A continuous test-and-learn program connecting design decisions to customer behavior and business performance.
Citi’s conversion rate optimization program brought strategy, creative, user experience, analytics, technology, and business teams together to improve digital acquisition journeys. Small experiments informed larger redesigns, while each result sharpened the next question.
+52%Growth in incremental accounts year over year
+26%Test launches year over year
−18%Testing cost per account year over year
FY2025 results combine Cards and Retail Bank.
Control
Test
The program
Make experimentation part of the design process.
The work addressed the full acquisition journey: how people discover products, compare options, understand value, and move into an application. Tests ranged from headline and CTA changes to page redesigns, navigation, product recommendations, and the relationship between paid media landing pages and Citi.com.
Rather than treating optimization as a final polish, the program used behavioral evidence to shape the information architecture, modular design system, and customer experience across Cards and Retail Bank.
Michael’s role
Executive Creative Director · Razorfish
Creative leadership grounded in evidence.
Michael led design, user experience, and design strategy for Citi.com’s CRO program. He was actively involved in day-to-day work sessions and test ideation, challenging assumptions and exploring how technology could make testing more effective and efficient. He connected creative direction with the test-and-learn agenda, helping translate findings into improvements across product detail, category, and comparison journeys.
The testing scope included more than 15 credit card product pages, Featured Cards, and View All Cards. Michael also helped extend the program’s approach to other lines of business within Citi and other accounts across Razorfish, shaping a cross-functional operating model that supported greater testing velocity and shared learning.
Turn hypotheses into clear interaction, content, layout, and visual design alternatives.
Technology & QA
Assess feasibility, implement Adobe Target tests, validate experiences, and support production rollout.
Business & delivery
Citi acquisition and product stakeholders, legal reviewers, client services, and project management align priorities, approvals, and delivery.
Co-location and recurring joint reviews connected Citi and Razorfish teams. Adobe Analytics and Glassbox informed opportunities; Figma, Jira, and shared review rituals connected the work to execution.
Areas of testing
First impressions: headline clarity, offer hierarchy, hero imagery, card art, and CTA visibility.
Product discovery: list versus grid layouts, category navigation, comparison tools, and cross-sell modules.
Content and interaction: benefit presentation, calculators, sticky navigation, drawers, and swipe behavior.
Results were read across the funnel: application start rate, application complete rate, and net conversion rate. A lift in initial engagement alone did not establish a stronger acquisition experience.
Selected design & UX tests
Mobile hierarchy · AA Platinum PDP
Give the next action priority over the card art.
Question
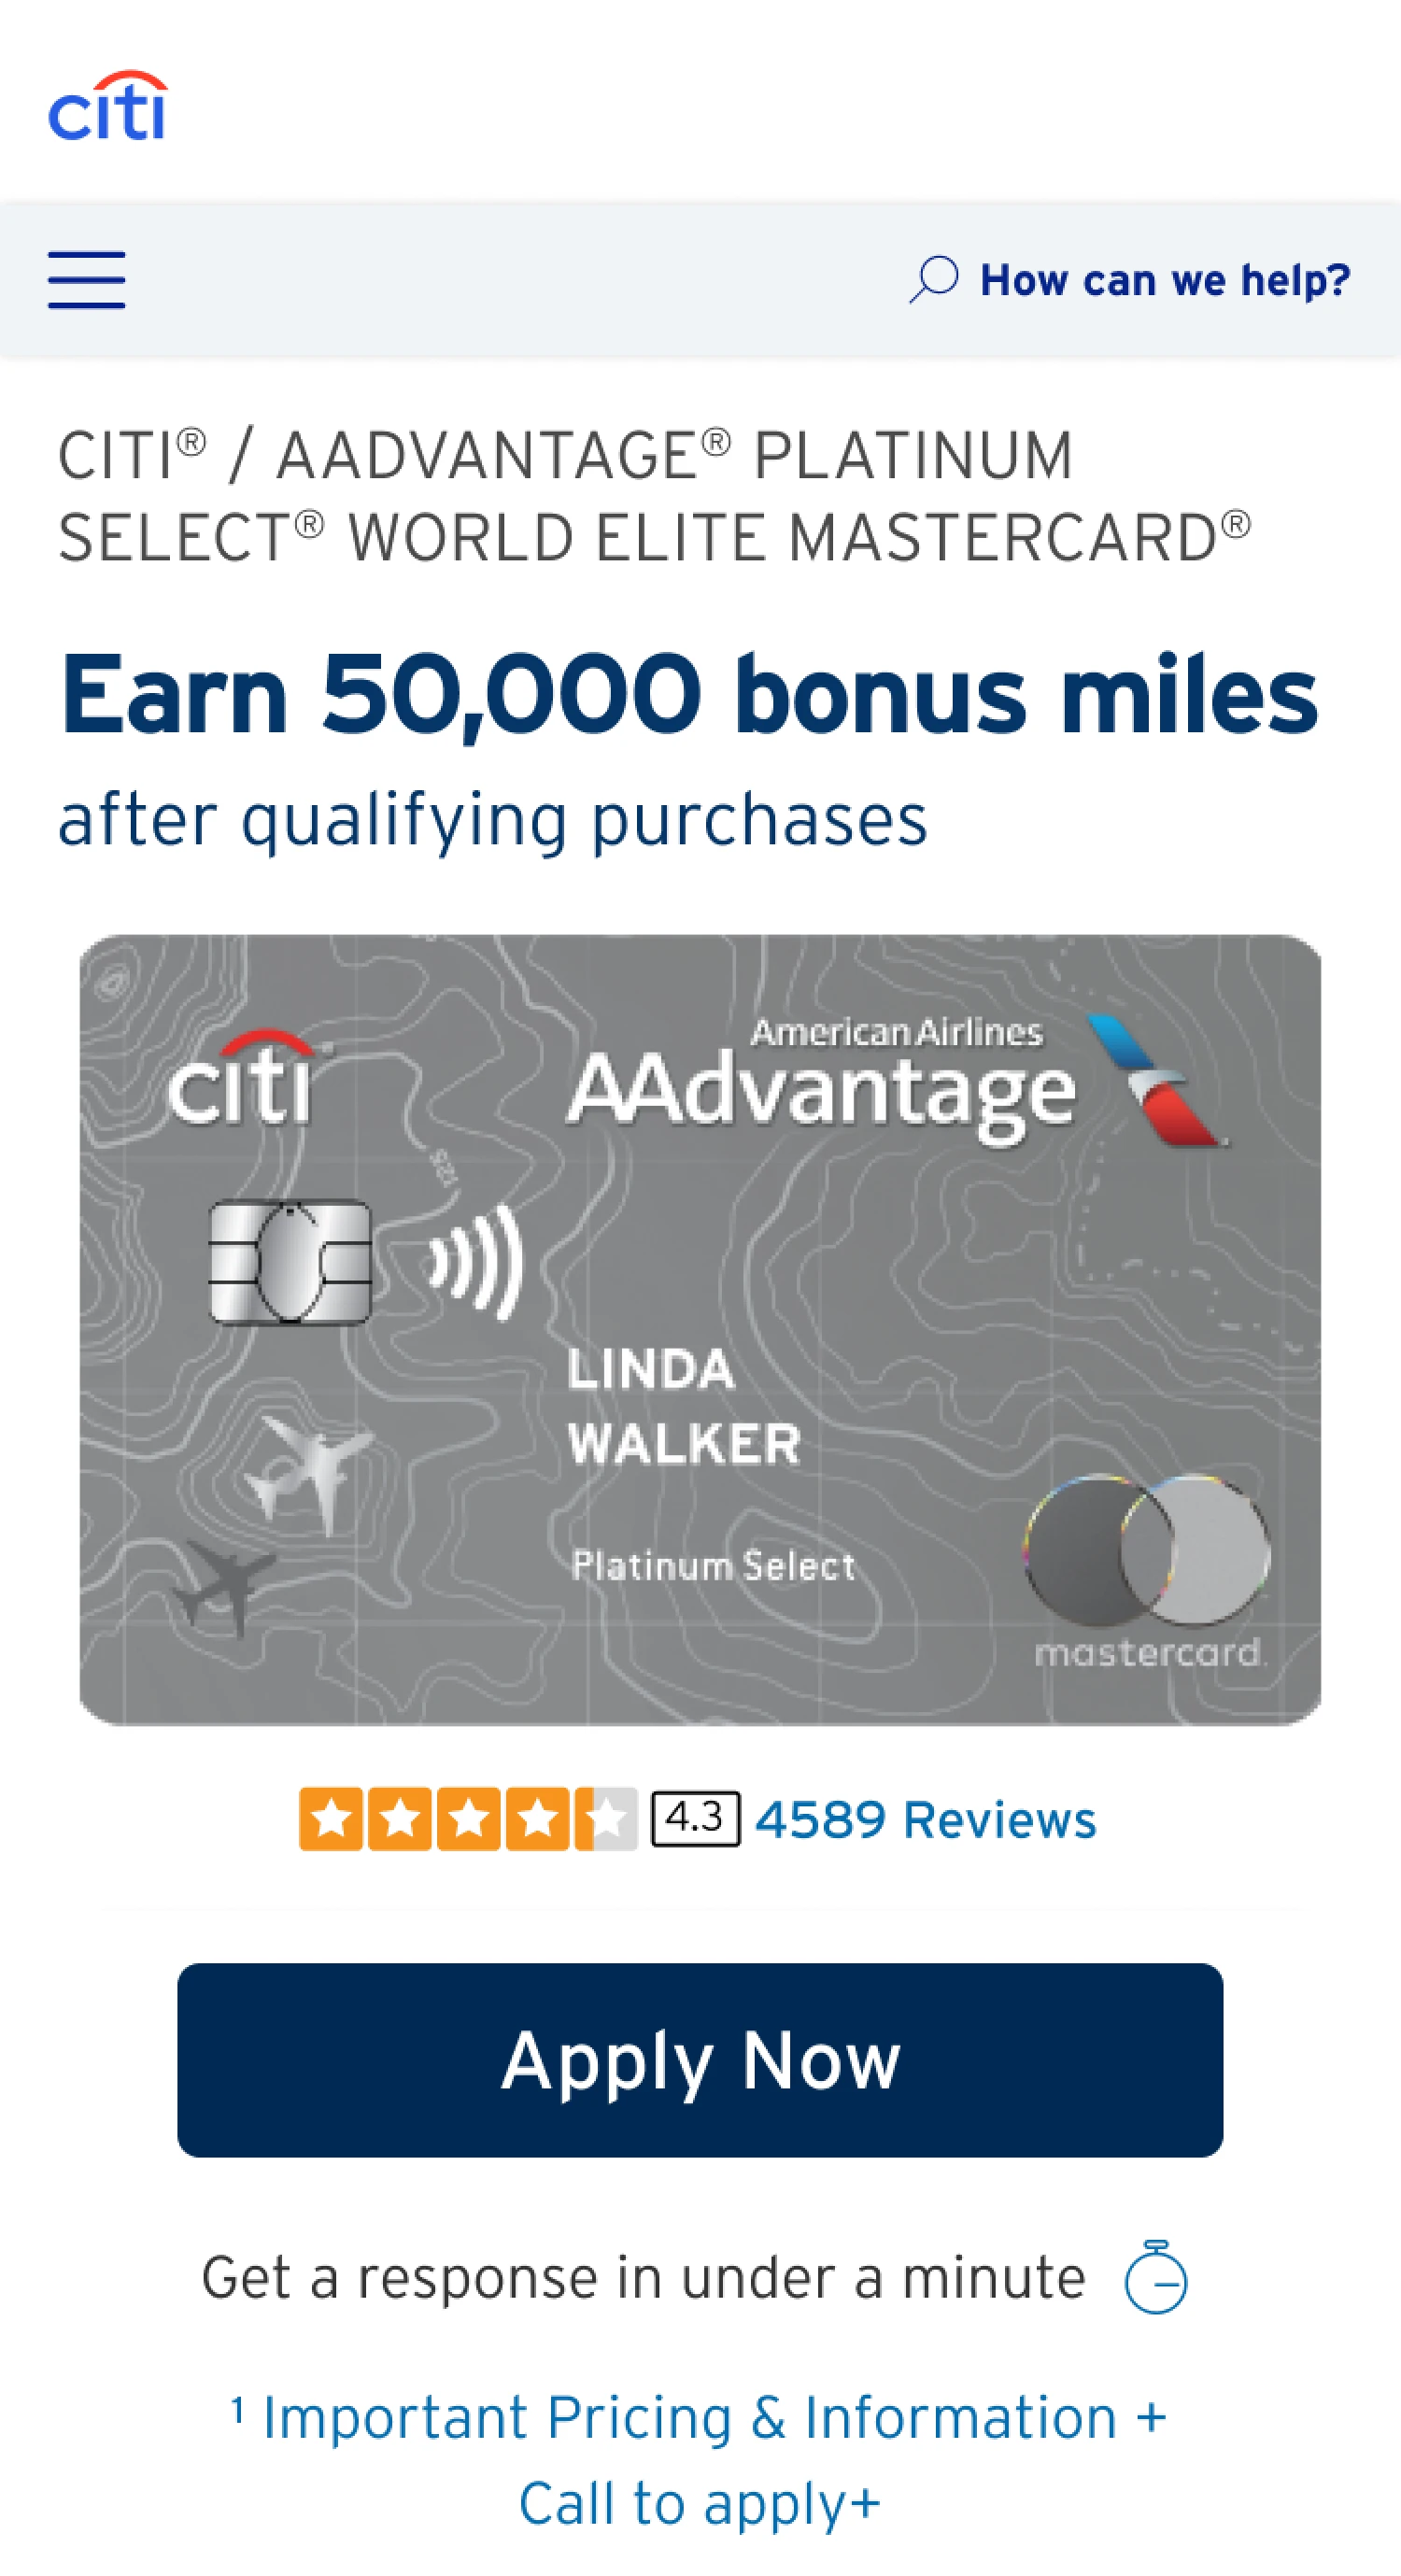
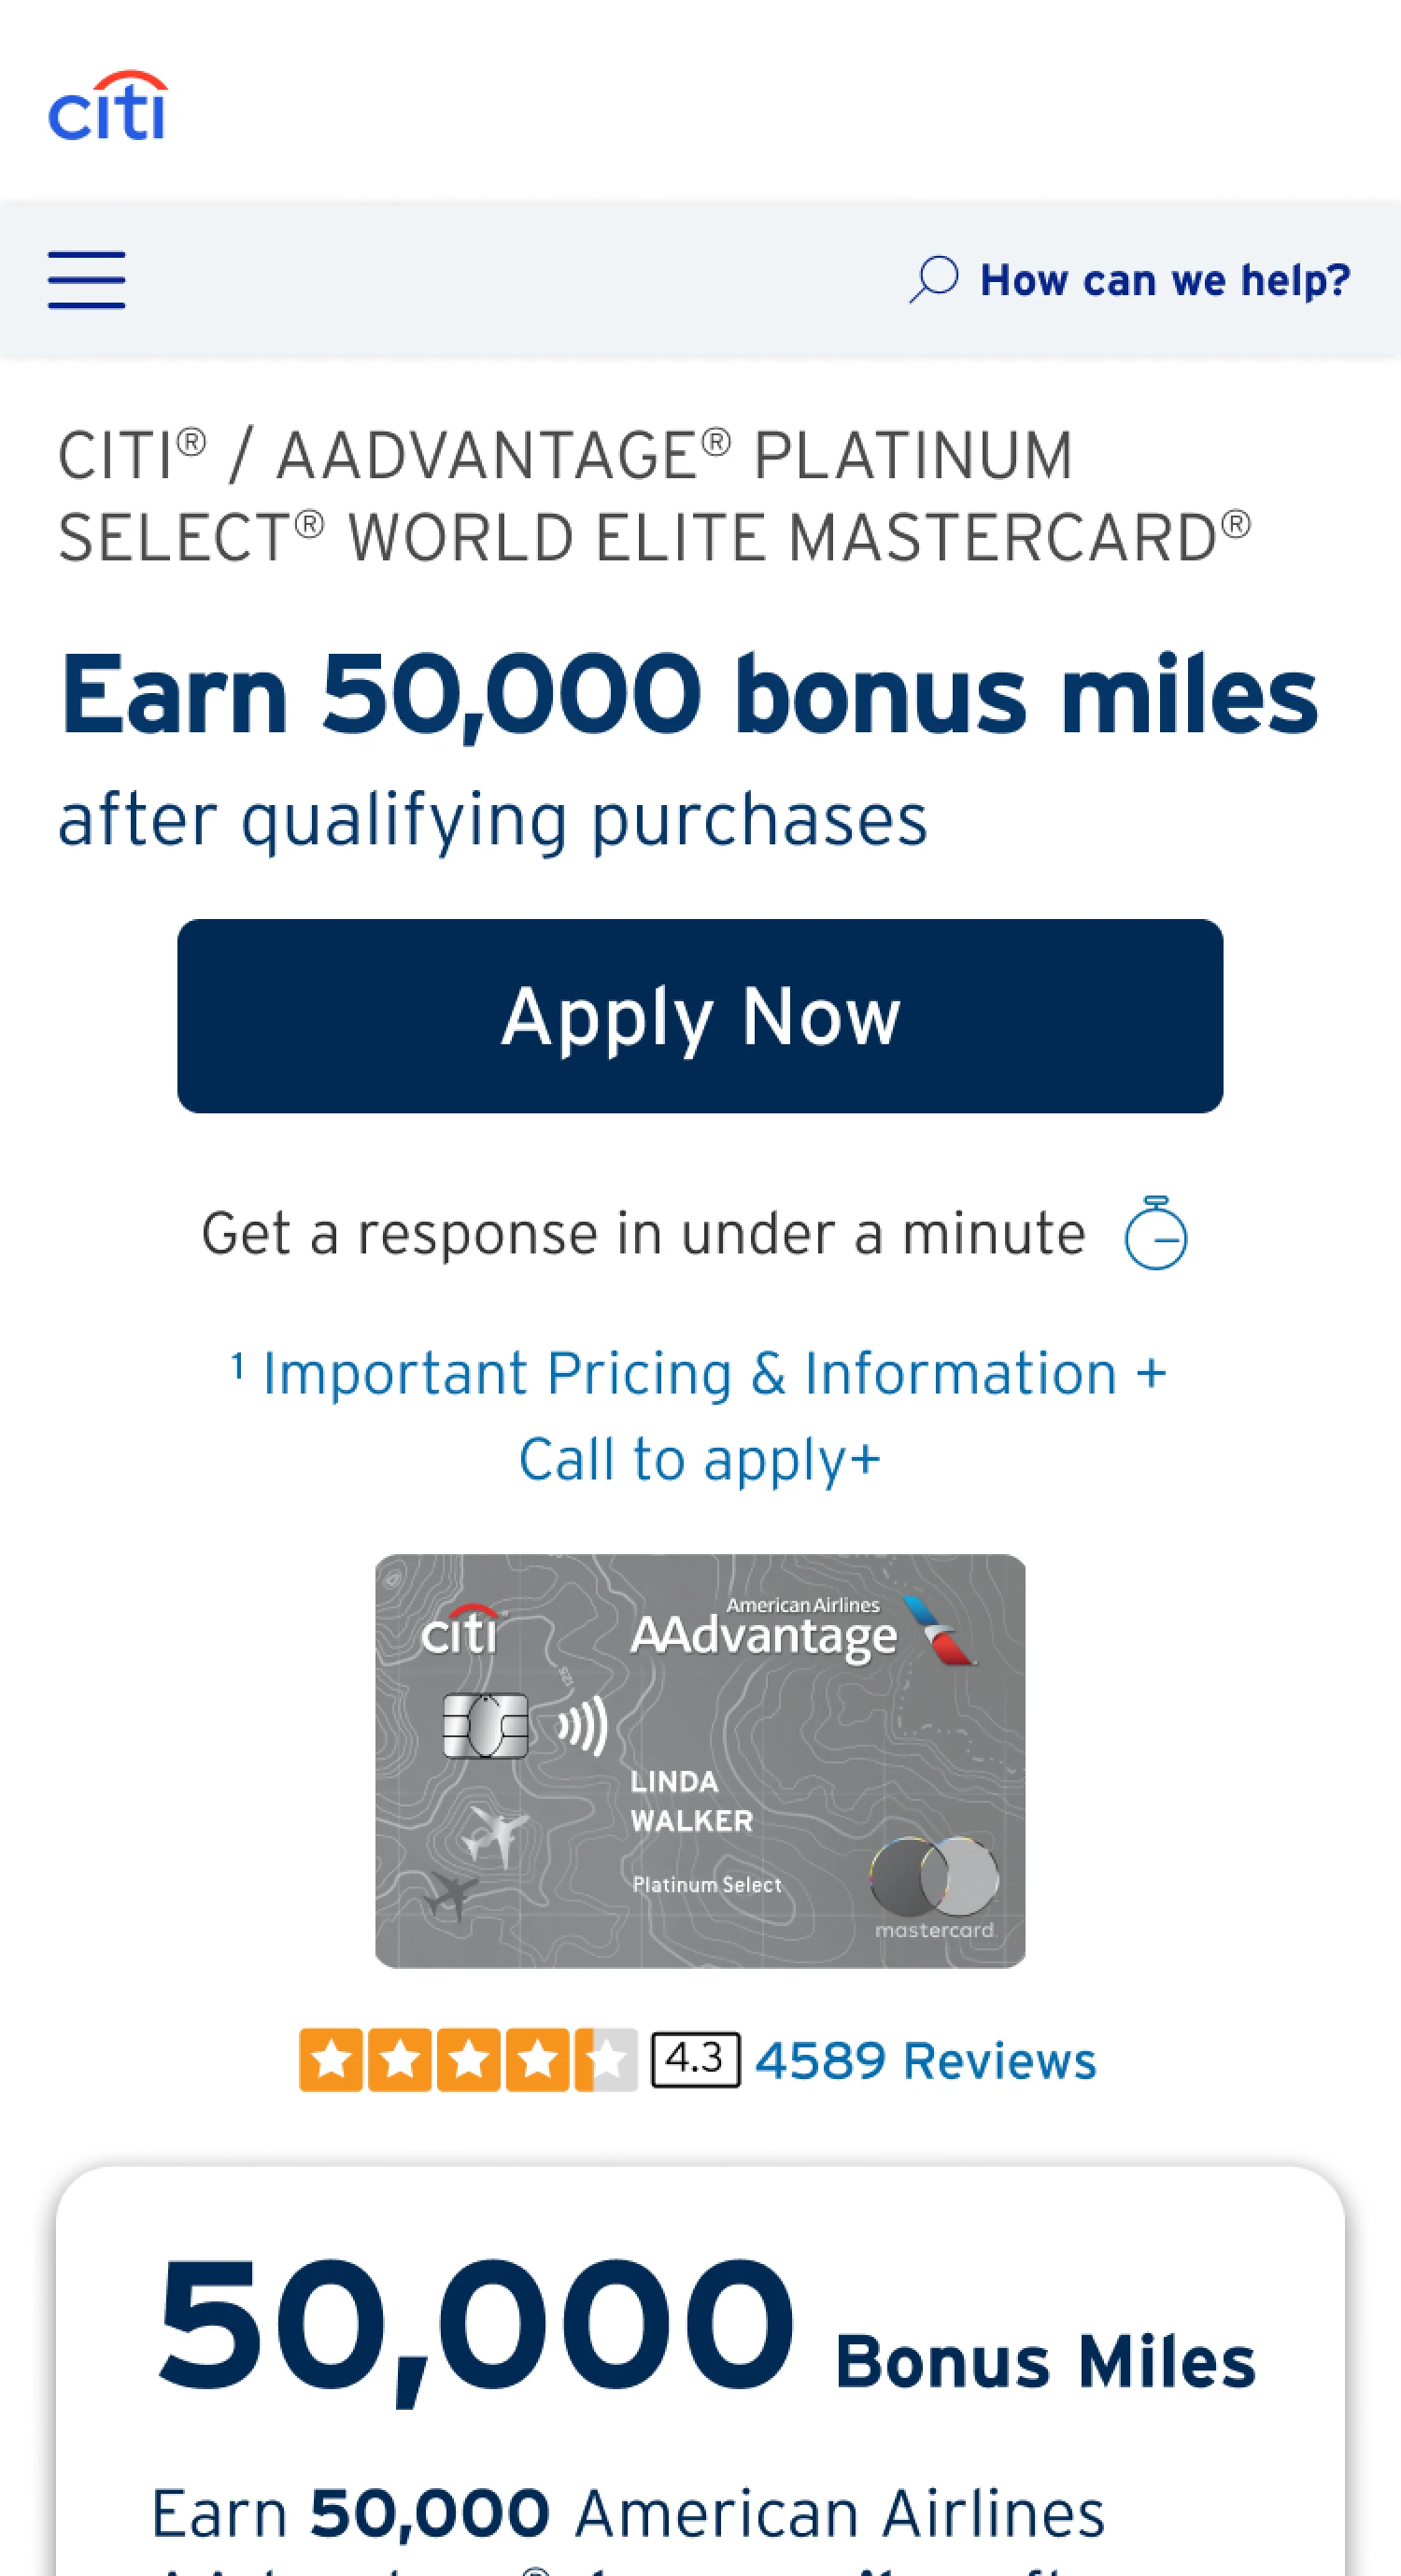
Would smaller card art and a more prominent Apply Now button help mobile visitors begin and complete an application?
Design change
Test multiple hero arrangements that bring the primary CTA above the fold and reduce the visual dominance of the card image.
Result
+1.4% application start rate and +16% application complete rate for the top-performing variant in June 2024.
Learning
Prioritize the action and value proposition in the limited mobile viewport.
Control
Test
Screens illustrate the design pattern; the June 2024 results are not attributed to these specific screenshots.
Product discovery · View All Cards
Help people scan, compare, and choose.
Question
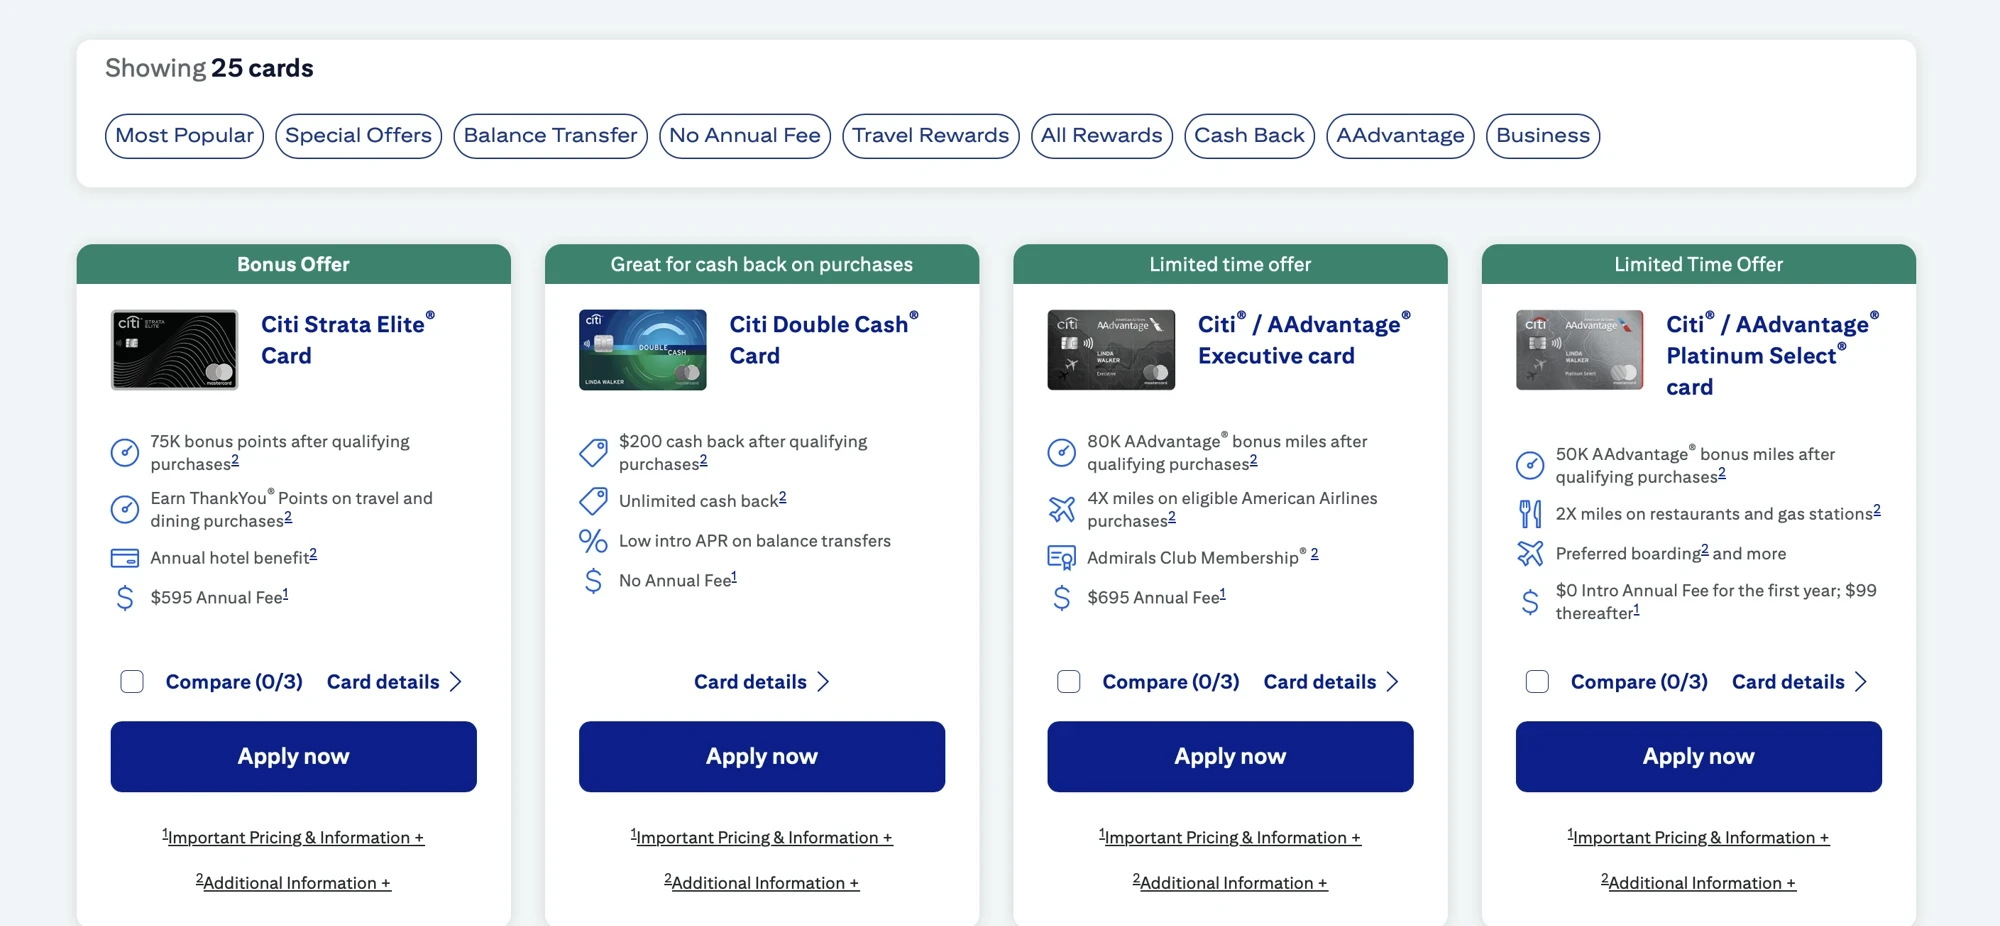
Could a grid help customers explore the portfolio more effectively than the existing list?
Design change
Introduce a card grid with concise benefits, category organization, and accessible comparison controls.
Result
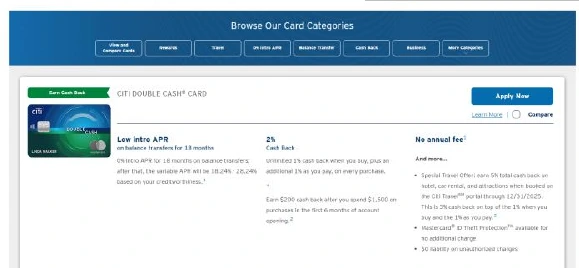
+18% net conversion rate versus the previous View All Cards experience. The grid also increased engagement with the compare feature, informing the next round of test ideas.
Learning
Product discovery and comparison are part of conversion. Clear structure can help visitors move beyond the first few products and make a more informed choice.
Control
Test
The test ran May 30–June 22, 2025. The positive outcome supported a production rollout.
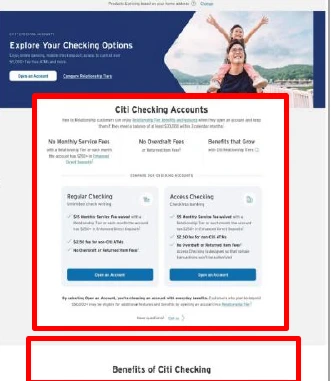
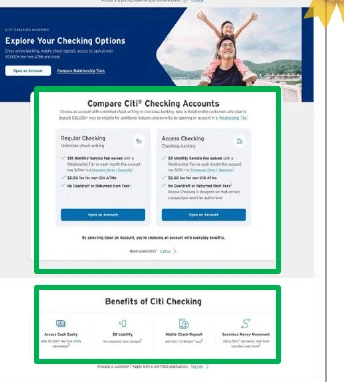
Decision support · Checking Overview
Put comparison closer to the decision.
Question
Would customers benefit from seeing the account comparison sooner, with less competing benefit content?
Design change
Remove a separate reasons-to-believe module, elevate the Regular and Access Checking comparison, and simplify the surrounding presentation.
Result
+4.1% application start rate and +2.1% application complete rate for consolidated account comparison.
Learning
Consolidated comparison can do more to support a choice than another layer of promotional content. The right content hierarchy helps customers distinguish options.
Control
Test
Interaction design · Custom Cash PDP
Less scrolling is not automatically less friction.
Question
Could swipeable benefit content reduce scrolling and improve a mobile page with high abandonment?
Design change
Test horizontally swipeable content within the key value propositions section as an alternative to a vertically stacked layout.
Result
A 5% decline in application start rate.
Learning
A compact interface can hide useful information or make it harder to discover. Evaluate the interaction through observed behavior rather than assuming fewer visible steps create a better experience.
Program outcomes
Compounding improvements, supported by shared learning.
Across Cards and Retail Bank, the FY2025 program achieved 52% growth in incremental accounts, a 26% increase in test launches, and an 18% reduction in testing cost per account year over year.
Learnings from the testing informed the introduction of a Featured Cards page and guided the redesign of product detail pages and the View All Cards experience—turning individual test insights into broader improvements across the customer journey.